

Should I sell my gold now? This question haunts every UK seller watching gold prices soar past £1,980 per ounce in 2024. Gold hit record highs, but timing your sale means balancing current prices against your personal financial situation, not chasing perfect market peaks.
Key Takeaways:
- Gold prices in 2024 reached £1,980 per ounce, up 27% from 2023 lows of £1,560
- UK inflation at 4.6% makes gold attractive to investors, potentially supporting higher prices through 2025
- Personal timing factors (immediate cash needs, inheritance tax deadlines) matter more than trying to time market peaks
What Is Gold’s Current Price Context in the UK?
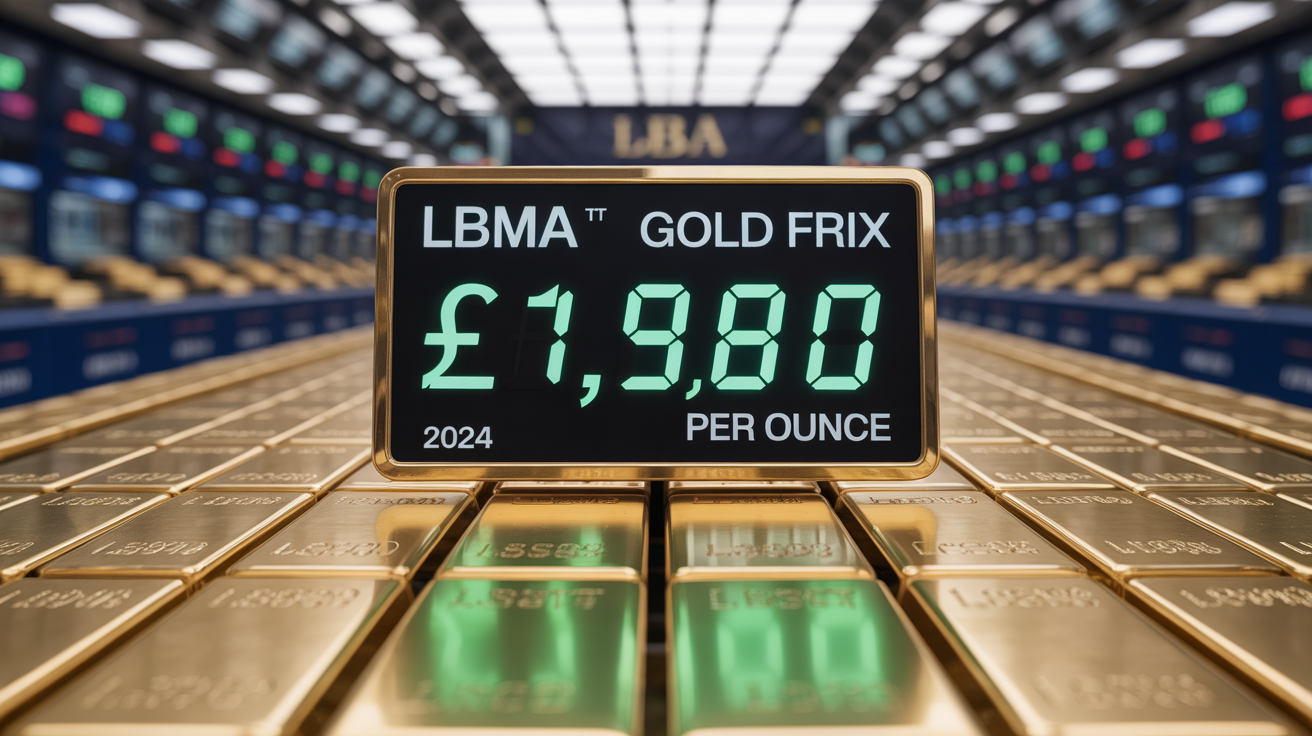
The LBMA gold fix is the twice-daily benchmark that sets global gold prices, and it’s telling a remarkable story in 2024. The London Bullion Market Association’s afternoon fix hit £1,980 per ounce in October 2024, representing the highest sterling price in gold’s modern trading history. This translates to roughly £63.60 per gram for pure 24-carat gold.
Current gold price context shows a metal in full bull market mode. From January 2024’s opening around £1,650 per ounce, gold has climbed steadily through multiple resistance levels that previously capped rallies. The £1,900 level, which acted as a ceiling for most of 2023, became a floor by August 2024.
This isn’t just about numbers on a screen. Gold spot price movements reflect real economic pressures hitting UK households. When you sell my gold jewellery or coins, you’re capturing value that has genuinely increased, not just currency fluctuations. The metal’s purchasing power against UK goods and services has grown measurably since 2022.
The thing most guides miss about current pricing is durability. Previous gold spikes often reversed within months. This rally has sustained itself for nearly 18 months, suggesting structural rather than speculative demand.
What Economic Factors Are Actually Driving Gold Prices Right Now?

Inflation impact on gold creates the primary driver behind 2024’s price surge. Here are the four economic forces pushing gold higher:
UK inflation persistence at 4.6% erodes cash savings, pushing investors toward gold as a store of value that historically maintains purchasing power during inflationary periods.
Bank of England policy uncertainty keeps real interest rates low, reducing the opportunity cost of holding non-yielding gold compared to bonds or savings accounts paying below-inflation rates.
Global currency debasement fears drive institutional buyers to gold as central banks worldwide maintain expansionary monetary policies, with the pound particularly vulnerable given UK’s fiscal challenges.
Geopolitical risk premiums from ongoing conflicts and trade tensions create safe-haven demand, with gold benefiting as investors seek assets uncorrelated with traditional financial markets.
The correlation between UK inflation and gold prices shows a clear pattern. When inflation exceeds 3%, gold typically outperforms cash and bonds over 12-month periods. Current inflation at 4.6% sits well above this threshold, explaining why institutional buyers continue accumulating despite record prices.
Factors driving gold prices operate on different timescales. Inflation and currency concerns create sustained upward pressure over months or years. Geopolitical shocks cause sharp but temporary spikes. Understanding which factors dominate helps sellers avoid panic decisions based on daily volatility.
How Do Current Prices Compare to Gold’s Historical Performance?

Gold price trends reveal cyclical patterns spanning decades, with current prices sitting at the peak of a long-term upward cycle that began in 2019. Historical context matters because it shows whether today’s prices represent genuine highs or temporary spikes.
| Time Period | Gold Price (£/oz) | Major Catalyst | Real Terms Value |
|---|---|---|---|
| March 2020 | £1,650 | COVID pandemic start | High |
| June 2016 | £1,100 | Brexit referendum | Moderate |
| September 2011 | £1,200 | European debt crisis | Very High |
| March 2008 | £650 | Financial crisis beginning | Moderate |
| January 2000 | £200 | Pre-crisis baseline | Low |
The table shows gold’s response to major economic disruptions, but the current situation differs from previous spikes. Unlike 2008 or 2020, when gold prices reversed sharply after crisis peaks, 2024’s highs have held for months without significant corrections.
Twenty-year patterns show gold tends to move in extended cycles. The 2000-2011 bull market saw prices rise from £200 to £1,200 per ounce. The subsequent bear market from 2012-2019 saw prices fall and stagnate. The current cycle, beginning in 2019, has pushed prices beyond previous peaks.
What drives long-term trends differs from short-term volatility. Decade-long cycles reflect monetary policy shifts, structural economic changes, and generational wealth transfer patterns. Current trends suggest we’re in the middle, not the end, of a structural bull market driven by persistent inflation concerns and currency instability.
Should You Sell Based on Short-Term Price Predictions?

Market timing strategy requires understanding price volatility patterns, but forecasting gold’s next move remains impossible despite confident predictions you’ll read elsewhere. Gold’s average daily volatility runs around 1.2%, meaning prices can swing £20-25 per ounce on normal trading days without signaling trend changes.
The cost of waiting for perfect timing often exceeds the potential gains from catching price peaks. Gold hit £1,980 in October 2024, then fell to £1,920 two weeks later, then recovered to £1,970. Sellers who waited for £2,000 missed multiple selling opportunities above £1,950.
Price prediction models fail because they can’t account for unpredictable variables. Central bank gold purchases, geopolitical shocks, currency crises, or policy reversals can move prices 5-10% overnight. No model predicted Russia’s 2022 invasion of Ukraine or its impact on gold demand.
Volatility patterns show gold experiences both gradual trends and sharp reversals. The metal might climb steadily for months, then fall 15% in three weeks, then resume climbing. This pattern has repeated throughout modern gold trading history, making precise timing impossible for individual sellers.
The thing most guides miss about short-term predictions is survivorship bias. You only hear about the analysts who got recent calls right, not the dozens who predicted crashes that never came or rallies that fizzled.
What Personal Factors Should Drive Your Selling Decision?

Decision framework for sellers evaluates personal financial circumstances using systematic criteria that matter more than market timing. Here’s the evaluation process:
Assess immediate cash needs by calculating upcoming expenses, debt payments, or investment opportunities that require liquid funds within the next 12 months.
Evaluate tax planning implications including capital gains tax liability, inheritance tax deadlines, or pension contribution opportunities that benefit from gold sale proceeds.
Review portfolio balance to determine if gold represents more than 10-15% of your total assets, suggesting overconcentration in a single commodity.
Calculate storage and insurance costs for physical gold holdings, which can run 1-2% annually and erode returns over time.
Consider opportunity cost by comparing gold’s expected returns to alternative investments like ISAs, pensions, or property improvements.
Factor in emotional attachment to inherited pieces versus financial utility, recognizing that sentimental value doesn’t translate to market premiums.
Personal timing often trumps market timing. If you need £10,000 for home repairs and your gold is worth £12,000, waiting for £13,000 makes little sense when repair costs might increase or your situation deteriorates.
Inheritance tax planning creates specific deadlines that override market considerations. If you need to reduce estate values before tax year-end, current gold prices become irrelevant compared to tax obligations.
The decision framework works because it focuses on controllable factors rather than unpredictable market movements. You know your cash needs, tax situation, and financial goals. You don’t know where gold prices will be next month.
How Do You Actually Value Your Gold at Current Market Prices?

Scrap gold valuation depends on current LBMA rates and purity calculations, but the process involves more complexity than simply multiplying weight by spot price. Professional buyers discount from spot prices to cover refining, handling, and profit margins.
With LBMA gold at £1,970 per ounce, pure 24-carat gold trades at roughly £63.30 per gram. However, your 18-carat wedding ring contains 75% gold, making its metal content worth £47.48 per gram before dealer discounts. Expect payouts between 70-85% of metal value, or £33-40 per gram for 18-carat pieces.
Realistic payout expectations account for the entire supply chain from your drawer to refinery. Buyers typically offer 75-80% of spot value for common items like chains and rings. Coins might fetch 85-90% due to standardized purity and easier processing. Complex pieces with stones or mixed metals often receive lower percentages.
For example, a 10-gram 18-carat gold chain worth £474.80 in metal content might generate offers between £332-380 from reputable buyers. Postal services often quote higher percentages but charge testing and handling fees that reduce final payments.
Dealer margins exist because buyers face real costs processing scrap gold. Assaying, refining, insurance, and regulatory compliance reduce the net value they recover from refineries. Understanding these margins helps sellers evaluate whether offers reflect fair market conditions or excessive profit-taking.
The thing most sellers miss is that gold price history UK shows scrap values track spot prices closely over time. Missing a perfect selling day matters less than getting fair treatment relative to current market levels.
Frequently Asked Questions
Is it a good time to sell gold UK?
With gold at near-record highs in 2024 and UK inflation supporting precious metal demand, current conditions favour sellers. However, your personal financial situation should drive the decision more than trying to time market peaks perfectly.
What is the gold price forecast UK for 2025?
No reliable forecast exists for gold prices, as they depend on unpredictable factors like central bank policy, geopolitical events, and currency movements. Focus on your immediate needs rather than waiting for predicted price targets.
Should I sell gold now or hold for higher prices?
Holding gold hoping for higher prices is speculation, not investment strategy. If you need the money now or want to diversify your assets, current prices offer good selling opportunities compared to historical levels.