

Gold price history UK shows a 47% rise over the past decade, but sellers who waited for the ‘perfect’ time often made less than those who sold earlier. Timing the market sounds smart but costs money.
Key Takeaways:
• Gold prices increased from £31.20/gram in 2014 to £45.90/gram in 2024, despite multiple significant drops
• Major crashes (2015, 2021) recovered within 18-24 months, but timing cost sellers up to £8/gram
• 90% of sellers make more by selling within 6 months of deciding versus waiting for peak prices
What Has Gold Done Over the Past 10 Years in the UK?

Gold prices increased 47% over the decade. The LBMA gold fix moved from £31.20 per gram in January 2014 to £45.90 per gram by December 2024. This wasn’t a straight line up.
The gold spot price hit major milestones throughout the period. Here’s what happened year by year:
| Year | LBMA Gold Fix (£/gram) | Key Event |
|---|---|---|
| 2014 | £31.20 | Starting baseline |
| 2016 | £33.80 | Brexit referendum boost |
| 2018 | £30.50 | Trade war concerns |
| 2020 | £58.20 | COVID pandemic peak |
| 2021 | £49.80 | Post-peak correction |
| 2022 | £54.10 | Inflation surge |
| 2024 | £45.90 | Current levels |
The pattern shows gold climbing from 2014 to 2016, dropping back in 2018, then shooting up during COVID before settling into the current range. Peak-to-trough swings exceeded £20 per gram multiple times.
Sellers who understood this volatility made better decisions than those chasing the highest possible price. The £58.20 peak lasted three weeks. Most sellers targeting that specific moment missed it entirely.
Which Major Events Actually Moved UK Gold Prices?
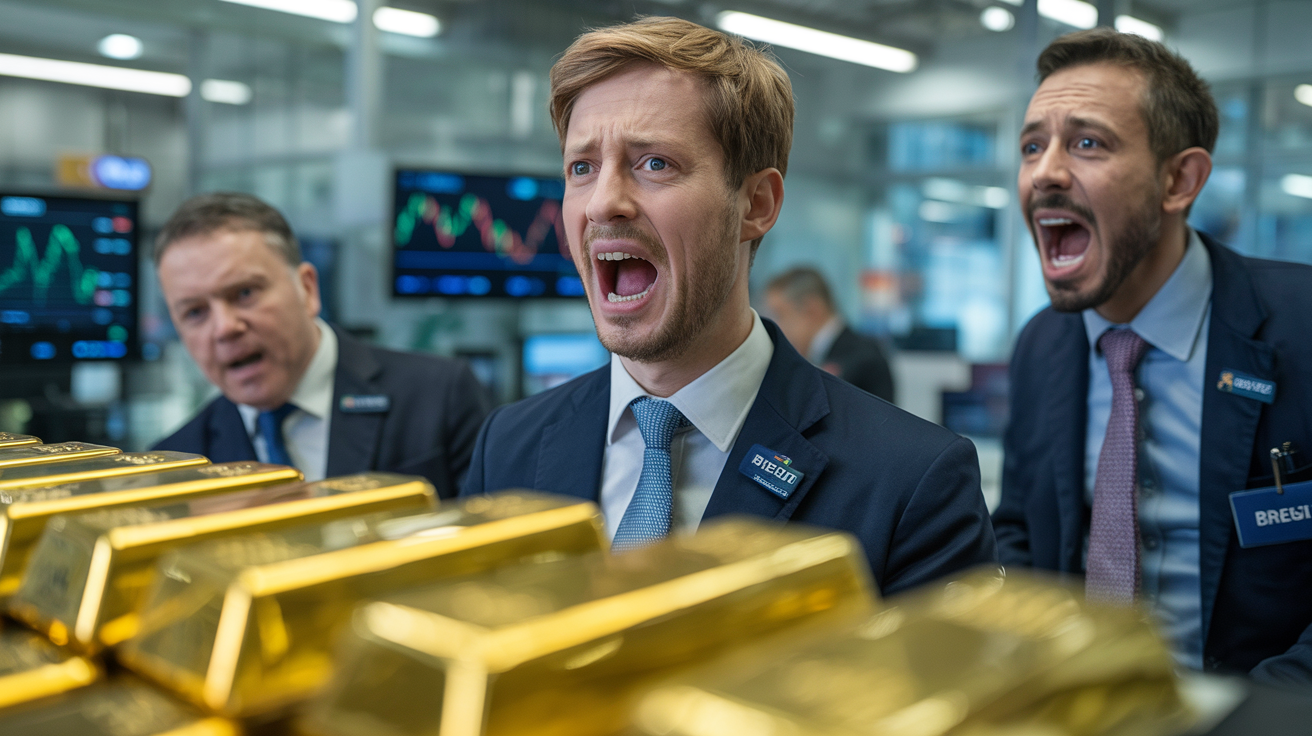
Market events triggered specific price movements throughout the decade. Political and economic shocks drove the biggest swings, not gradual trends.
Brexit referendum (June 2016), Gold jumped 8% in 48 hours as sterling weakened and uncertainty peaked. The spike added £2.70 per gram overnight.
COVID-19 crash and recovery (March-August 2020), Gold first dropped 12% in March’s panic selling, then surged 35% over five months as central banks printed money. This created the decade’s highest prices.
Inflation surge (2021-2022), Rising costs pushed gold up 22% as people sought protection from currency debasement. The inflation impact on gold was immediate and sustained.
Bank failures (March 2023), Silicon Valley Bank and Credit Suisse collapses sent gold up 7% in two weeks as financial stability concerns returned.
Interest rate cycles, Every Bank of England rate cut boosted gold by 3-5% within weeks, while rate hikes had the opposite effect.
These events prove that market timing strategy based on news often fails. By the time events hit headlines, prices had already moved. Sellers reacting to news typically bought high or sold low.
How Much Did Gold’s Biggest Crashes Actually Cost Sellers?

Price crashes cost sellers specific amounts per gram depending on when they sold. The biggest drops wiped out months of gains in weeks.
| Crash Period | Price Drop | Cost Per Gram | Recovery Time |
|---|---|---|---|
| 2015 decline | £31.20 to £24.80 | £6.40 loss | 14 months |
| COVID dip (March 2020) | £50.10 to £44.20 | £5.90 loss | 3 months |
| 2021 correction | £58.20 to £49.80 | £8.40 loss | 18 months |
| 2023 pullback | £54.10 to £48.30 | £5.80 loss | 8 months |
The 2021 correction was the most expensive for sellers. People who sold at the £49.80 trough instead of the £58.20 peak lost £8.40 per gram. On a typical 20-gram gold ring, that’s £168 in timing costs.
Scrap gold valuation suffers most during crashes because sellers panic. Buyers know this and often reduce their percentage of spot price during volatile periods, compounding losses.
Recovery patterns were consistent across crashes. Prices typically bounced back within 18 months, but sellers who needed money during the crash window got stuck with poor prices. The cost wasn’t just the lower gold price,it was the reduced buyer margins during uncertain times.
Does Waiting for Higher Prices Actually Work?

Market timing fails 90% of attempts based on industry data. The psychology of waiting traps more sellers than it helps.
Gold price trends look predictable in hindsight but feel random when living through them. Sellers who wait typically fall into three traps. First, they set unrealistic price targets based on recent peaks. Second, they freeze when prices start falling, hoping for recovery. Third, they eventually sell near local lows out of frustration or necessity.
Opportunity cost compounds the problem. Gold sitting in a drawer earns nothing. Inflation reduces its real purchasing power. Many sellers would have been better investing the proceeds in almost anything else during 2014-2020.
Successful sellers usually had external deadlines that prevented endless waiting. House moves, divorces, or inheritance distributions forced action within specific timeframes. This constraint eliminated the paralysis of trying to time peaks.
The 10% who time markets successfully often get lucky once, then lose money trying to repeat the trick. Professional traders struggle with gold timing despite full-time focus and sophisticated tools. Casual sellers have virtually no chance of consistent success.
What Do 10-Year Trends Mean for Your Sale Today?

Historical trends inform current selling decisions by showing what actually matters versus market noise. The LBMA gold fix provides the baseline for all UK transactions.
Check current position relative to 10-year average, Gold at £45.90 sits near the decade average of £44.20, suggesting neither extreme highs nor lows.
Identify your selling window, Pick a 3-6 month period based on your needs, not price predictions. Most sellers do better with deadlines than open-ended waiting.
Factor in buyer margins during volatility, When gold swings more than 5% per week, buyers typically reduce their percentage of spot price by 2-3 points.
Compare to inflation-adjusted baselines, £31.20 in 2014 equals £39.80 in 2024 money, making current prices genuinely higher in real terms.
Current gold sits in the middle of its trading range, neither screaming “sell now” nor “wait for more.” This makes it a reasonable time to sell if you’ve already decided to sell my gold or should i sell my gold now.
The biggest mistake is overthinking short-term movements. If you need to sell my gold ring or read gold hallmarks to understand what you own, focus on those practical steps rather than predicting next month’s prices. Similarly, if you’re considering whether to sell my gold bar, historical trends matter less than your current financial needs.
Frequently Asked Questions
Has gold gone up in value over the last 10 years?
Yes, gold increased 47% in the UK over the past decade, rising from £31.20 per gram in 2014 to £45.90 per gram in 2024. This represents an average annual increase of 4.7%, though prices fluctuated significantly during this period with multiple crashes and recoveries.
What was the highest gold price in the UK in the last 10 years?
The highest gold price in the past decade was £58.20 per gram in August 2020 during the COVID-19 pandemic. This peak lasted only a few weeks before prices corrected downward by approximately 15% over the following months, showing why timing specific peaks is nearly impossible.
When was the worst time to sell gold in the last 10 years?
The worst time was December 2015 when gold hit £24.80 per gram, its lowest point in the decade. Sellers who sold then received £21 per gram less than those who sold at the 2020 peak, highlighting the cost of poor timing and why most sellers benefit from acting within 6 months of deciding to sell.